DSP-10 Weak-Signal Update
2-Meter EME QSO with Single Yagis and 150 Watts
On 5 May 2001, Beb Larkin, W7SLB, and Bob Larkin, W7PUA, completed a PUA43 mode EME (Moonbounce) QSO on 2-meters using a single Yagi antenna at each end and 150 Watts or less transmitter power. This is believed to be substantially less station capability than has been used for previous EME QSO's using any mode.

Circular polarization was used with Yagis of boomlength 18 and 34 feet. A total of 6-1/2 hours of transmission time was involved over 3 evenings. Call signs, grid squares and acknowledgments were exchanged.
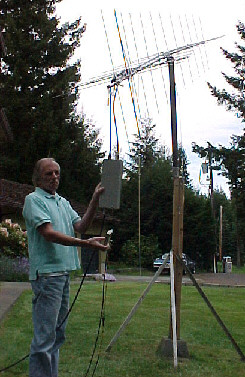
On the left is Beb with the 18-foot K1FO style antenna arranged for circular polarization. The hybrid coupler is hanging from the antenna and Beb is holding the receiver preamp. All other equipment, including the DSP-10, 8-Watt Brickette and 150 Watt amplifier were inside the ham shack.


Here are the top lines from the PUA43 screen of the DSP-10 transceivers showing the copy. The differences in color are indicative of difference in setup rather than better or worse copy. Note that in one case the character (the 'U' in W7PUA) was in the second-choice top row, rather than the primary bottom row. This is allowable copy in the context of message estimation.
Much more detail of the setups and operation is available in text form.
Both participants feel that it will be possible to streamline the operation too reduce the time involved, or to reduce the power levels even further by extending the time involved. Much still needs to be demonstrated in DSP-aided QSO's.
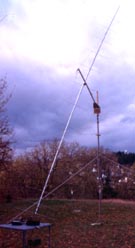
Another Picture: On the right is the 34 foot Yagi used at W7PUA. This is a standard product from M2. There are 14 elements in each of two planes that are at right angles. As the antenna is setup, the two sets of elements are each at 45 degrees to either the vertical or horizontal plane. A 5 foot insulated mast is hinged at the top of the TV mast.
The hybrid coupler for the antenna, receiver preamp and transmitter amplifiers are all on the card table that is under the back of the Yagi. The DSP-10 is inside, about 150 feet away. (Picture added 9 May 01)
QRP 5-Watt 1296 MHz PUA-43 Mode EME QSO
On 25 February 2001 Ernie, W7LHL, and Larry, W7SZ, were successful with a PUA43 mode QSO on 1296 MHz EME (Moon bounce). They were using a QRP power level of 5-Watts and backyard TVRO dishes of 10 and 12 feet.
Copy was Q5 as can be seen on the screen at the left (click on it for a bigger version). They were using a 28 character setting on PUA43 (see below for more information on the PUA43 mode). The extra characters were being used for redundancy in portions of the message. The message would begin to appear in a few minutes, but Q5 copy was taking roughly 15 to 30 minutes per message. They exchanged call signs, grid squares, and confirmations both ways. Copy at W7LHL was not quite as good as for the other direction, but both stations received a complete message in the 28 characters. This was their first attempt at using the 5-Watt level for a QSO. As was reported earlier they had been successful at higher power during January.
None of those involved are aware of any previous 5 Watt 1296 MHz EME QSO's although this may well have been done using larger antennas. Any information on this would be appreciated.
The PUA43 mode described below is ideal for this type of work. The limits of signal strength have yet to be fully explored. Both Ernie and Larry reported that they were kept busy with antenna pointing and playing screen "anagrams," so were not sure what their patience level might be if the power kept dropping. The nature of the mode is to trade-off time for increased sensitivity.
W7LHL Receives 10 GHz 1.2-Watt Self Echoes
On 17 February 2001, Ernie Manly, W7LHL was successful in receiving his own echoes off the Moon at 10.368 GHz. This is quite commonplace these days for the advanced microwave experimenter, but Ernie's success was important because he he was running only 1.2 Watts and using a 10 ft TVRO parabolic dish. The key to making this work was the long-term integration capability of the EME-2 mode in the DSP-10 transceiver.
A few calculations show that the received signal strength should have been about -165 dBm. This would be roughly 20 dB below the level that can be heard with the ear. The measured returns have been about 7 dB below the -165 level. The measured system Noise Temperature was about 180 K. It must be that the assumed 50 per cent efficiency for the parabolic dish is not accurate or that reflection coefficients are not accurate or perhaps other factors.

On 20 February 2001, Ernie made further EME-2 measurements as shown here. The long-term (about 18 minute) integrated, relative S+N, response is the yellow trace with the distinctive double peak. It is at a scale of 0.1 dB/division. The results are interesting in terms of not only receiving his signal, but in measuring the spectrum of the return. From terrestrial contacts with other stations, the spectrum of Ernie's transmitter and LO are known to be quite clean. Therefore, the measured spectrum represents the Doppler spreading of the EME path. The bandwidth of the FFT was 9.4 Hz and this will broaden the apparent spectrum by about this amount. But what was observed was sufficiently wider for this to not be a major factor. The plot above is the top part of the DSP-10 screen (the bottom of the waterfall continues as shown---there is not much to see!) Libration-caused spectral spreading has been observed by all 10 GHz EME operators, but it is interesting that Ernie was able to get useful measurements of this effect at the low power level.
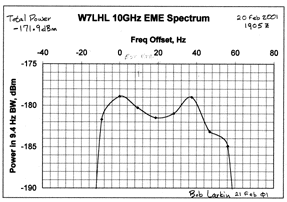 The graph to the left
shows the results of some calculations that I (W7PUA) did with
Ernie's data. Starting with the measured (S+N)/N in each bin, I
used the measured noise temperature of 180 degrees to estimate
the return signal power spectral density. This gives a plot with
less effect from the noise. But, a signal of -180 dBm is noisy
and the results should be considered tentative until more power
is available. But, the general levels and the double-peaked shape
were reported by Ernie as quite repeatable. A possible
explanation for the particular shape is that the beamwidth is
slightly smaller than the moon (maybe 0.4 and 0.55 degrees) and
Ernie reported that he was keeping the antenna beam centered by
peaking on Moon noise. He would let the Moon drift to the edge of
his beam and then correct it, sometimes moving a bit ahead. Quite
possibly what is being seen is the Doppler due to libration
sometimes towards one side of center and sometimes towards the
other side. Depending on the distribution of time in each area,
the spectrum would be shifted that way. Also note that the
average spectrum is offset by about 20 Hz to the right. It is
known from many 1296 measurements that the Doppler routines in
the DSP-10 Rev 2 software have typical errors of 1 to 2 Hz at
that frequency which would be 8 to 16 Hz at 10368 MHz. This is
likely a large part of the shift, but further investigation is
needed. By the way, if you add up all the power (in Watts, not
dBm) you get -171.9 dBm total received power.
Bigger Signals! As a follow up to the 10 GHz EME-2 work described above, Ernie, W7LHL, did further experimentation with self-echoes. The received signal level was increased close to 10 dB by increasing the transmit power to 4 Watts, waiting for Moon perigee, and possibly other factors such as increased skill at Moon tracking. The screen shot from Ernie shows the waterfall results for several tests. The yellow, long-term integration trace at the top is the result of only the bottom part of the waterfall starting just below the mark "49:33_". Note that the scale for this yellow trace is 1 dB/division, whereas it was much more expanded in the earlier experiment above (this is automatically scaled to expand the trace without going off the screen). The maximum averaged (S+N)/N is 2.6 dB in the center bin. A constant RIT of 29 Hz was used to correct for errors in the Doppler calculations, with the result that the spectrum is centered. The same 10-foot dish and receiving setup was used as for the original experiments.
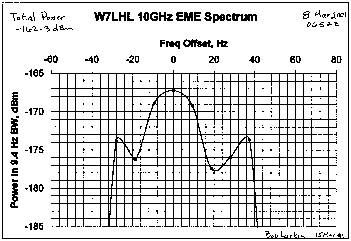
As shown here, I again calculated the signal-only spectrum, based on the assumed system noise temperature. Three peaks are seen on this spectrum and again the overall width is roughly 60 Hz. The overall total received power is calculated to be about -162 dBm.
Based on
experience, the signal levels that Ernie is receiving should be
adequate for easy QSO's using the PUA43 mode. He has not
attempted this yet. (Posted 15 Mar 01).
W7LHL and W7SZ Have 10GHz EME QSO Using PUA43
On 11 November 2001, Ernie Manly, W7LHL, and Larry Liljeqvist, W7SZ, completed a PUA43 mode EME (Moonbounce) QSO on 10368 MHz. Both stations were using 10 foot surplus TVRO antennas. Ernie was running 5 Watts and Larry, 15 Watts. This was their first try at such a QSO and the total elapsed time was about 45 minutes. The contact was important to evaluate the effects of dispersion that broadens the signals and makes the received frequency less well defined. The signals were far below the audible level throughout the QSO. This is believed to be the first PUA43 EME contact on 10 GHz.
![]()
![]()
Here are the top lines from the PUA43 screen of the DSP-10 transceivers showing the copy. In both cases the calls and grid squares were sent twice within a 28 character field. Copy was complete when the message had been received in at least one of the two transmitted positions. This is analogous to CW reception where the operator waits until the full message is received, even though it is not in a single contiguous group. Note that the stations had doubled up the message in two different ways. W7SZ use the first 14 characters for a full message with a repeat in the second 14 characters. W7LHL doubled up the characters throughout the message.
Both stations were using the DSP-10 with an external 10 GHz GPS-locked Shera frequency reference. Both used DB6NT transverters that were also locked in frequency. W7LHL used a solid-state 5-Watt amplifier and W7SZ ran 15 Watts output from a TWT amplifier. For both stations the microwave equipment was located at the feed for the parabolic antenna.
The Moon was near South for both stations resulting in the spectral dispersion being at its greatest. Angles to either the East or West would be expected to produce superior copy. In spite of this level of dispersion, the contact was made without difficulty.
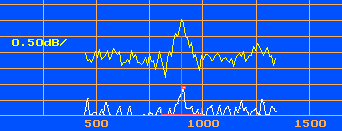 In order to measure the
signal being received from the Moon, both stations operated both
before and after the QSO in the EME-2 mode. This automatically
transmits 2-second pulses every 5 seconds. These are aligned in
frequency according to the calculated Doppler shift and long-term
power integration is used to reduce the affects of noise. At the
left is W7LHL's EME-2 echo spectrum, with the last return in
white at 2 dB/div and the power average of 123 returns in yellow
at 0.5 dB/div. The resolution bandwidth is 9.4 Hz and the signal
in this bandwidth is about 5.6 dB below the noise. The display
shows (S+N)/N power which is just over 1 dB at the center of the
yellow trace. Clicking on the trace shows a larger portion of the
DSP-10 screen for this same measurement. Due primarily to the
higher power used, the spectrum of the EME-2 trace received
by W7SZ has a peak (S+N)/N of about 2.8 dB, placing the
peak signal and noise at almost equal levels.
Congratulations to Ernie and Larry for building the stations and making the QSO!
More weak-signal results using the DSP-10 will be posted as they become available. Email these to boblark 'at sign' proaxis.com and I will try to put them here.
This was last revised 10 March 03. Bob Larkin, W7PUA