.USR File
right click and save as... this is a text file. Qi.USR
To load this ,without installing as a new menu item, use
"File".."Load Settings" from SL's main window .
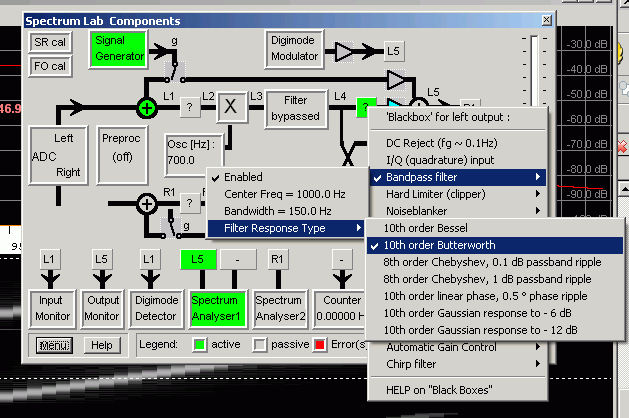
I used the Generator and a black box filter to test the concept of
measuring a filter.

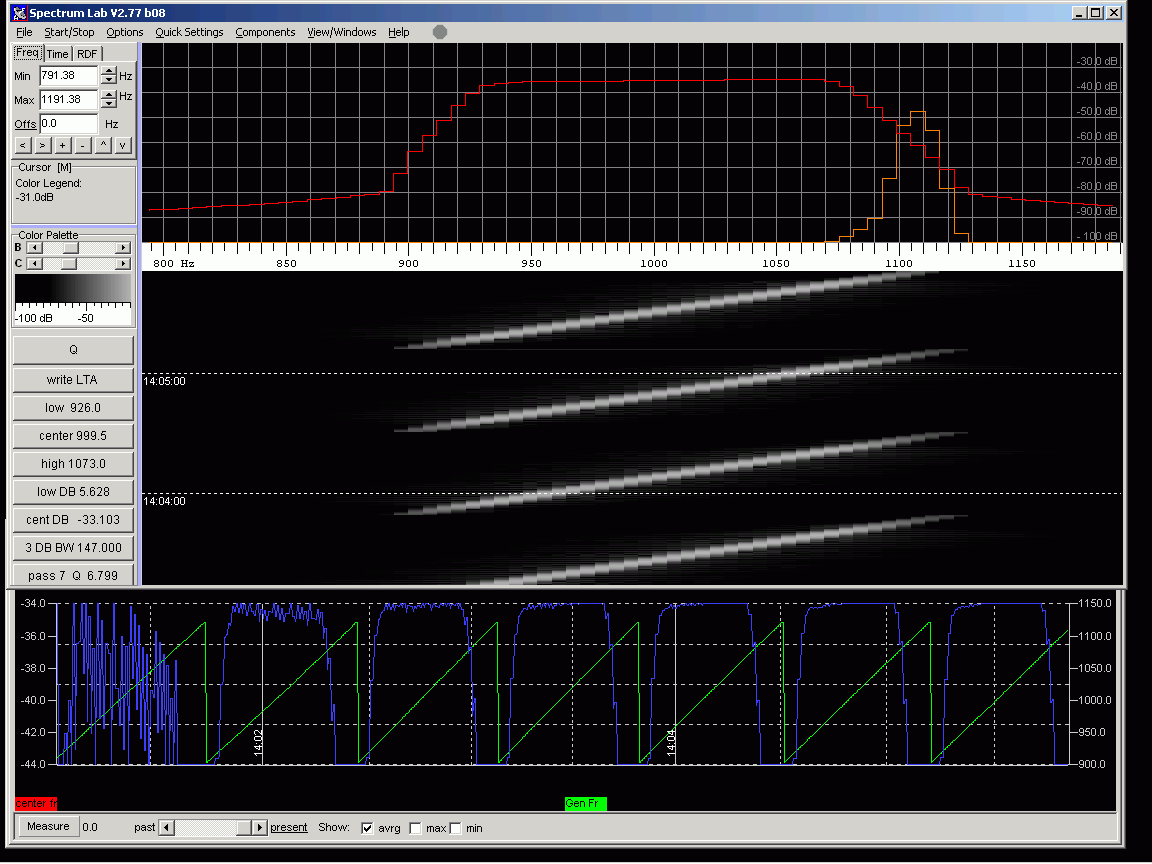
The filter shown is designed to 150 Hz bandwidth centered on 1000 Hz.
The calculated Q is 6.7777777
The test measured it as 147 Hz bandwidth and Q as 6.7999.
There is a button (write LTA) that will export the LTA trace, although
I did not find it very useful.
The Plotter was used to observe the samples and displays the first
7 iterations. I knew the frequencies and expected
results,
so the settings are to minimize the time needed to get a complete
a sweep of the passband. These can be changed if an unknown
filter is being tested.
It takes about 4 passes to get reasonable results, so this is not a
very fast method. Compared to post processing an exported file, it is
not unreasonable.
I also tried using the noise generator rather than sweeping a
generator. This worked, but needs more sampling to average
out
the random noise.

